Slope-Intercept Linear Graphing
One of the basic foundations of Algebra is linear equations and being able to graph linear equations. The most popular format is the slope-intercept format (y=mx+b). To understand more about linear equations and seeing it as y=mx+b, watch the following video:
Here is another explanation on linear equations: Purple Math This site does not use video, but only explanations. It is a great way to see the same information in another way. Feel free to go back to the video or the explanation if needed. There are other videos that can be watched if needed through the video link.
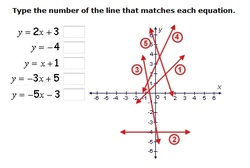
After seeing explanations through a video and through explanations, it’s time to see the equations put to practice. Match each equation with the correct graph. If help is needed, there are some hints available.
After seeing explanations through a video and through explanations, it’s time to see the equations put to practice. Match each equation with the correct graph. If help is needed, there are some hints available.
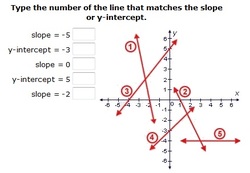
Another matching interactive activity is through this same site. Look at the graphs and connect the correct graph with the correct slope and y-intercepts
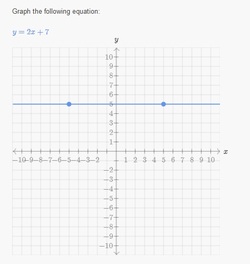
The last practice is to create the correct graph that matches the equation. This is opposite of the last two practices. There are hints if needed.
The reason linear equations are so important is it is used in many different ways. In order to fully understand linear equations, it needs to be seen used throughout real world problems. Here is site to try out using linear equations from several different storylines: Algebralab
Now it’s time to see what was learned through these different links. Go to CPMP tools, and the CAS tool. Using this graphing tool, create 3 linear equations. Print the screen with all 3 graphs and equations. Using one of the equations that was graphed, create a storyline in which this graph would be helpful. Include the storyline with the 3 graphs made.
Now it’s time to see what was learned through these different links. Go to CPMP tools, and the CAS tool. Using this graphing tool, create 3 linear equations. Print the screen with all 3 graphs and equations. Using one of the equations that was graphed, create a storyline in which this graph would be helpful. Include the storyline with the 3 graphs made.
Overview: Students will watch a video, read explanations, practice the skills through interactive programs and be able to create graphs and make a storyline using the graphs that were created.
Objectives: Students will learn how to graph linear equations using the slope-intercept format. They will also see a graph and verify what the linear equation would be to match the graph. Students will also be able to create graphs through data from story problems and be able to graph the equations made from the data.
Lesson Idea: Learn how to graph linear equations using y=mx+b format through the videos and links provided on the web page.
Links and Resources: Here are the links to the sites made for this virtual tour
- Khanacademy.org video
- Purplemath explanation
- Math.com matching graphs and equations
- Math.com matching slopes and y-intercepts
- Khanacademy.org interactive graph making
- Algebralab.org story problems using linear equations
- CPMP tools graphing calculator used for creating graphs
